Data Science
Smart EDGAR: Calculation of Growth Parameters
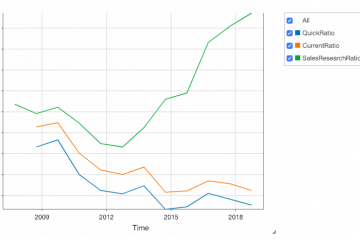
Financial KPIs can be used to drive investment decisions. So it was my goal to create a comprehensive set of KPIs across different dimensions that are based on the information which can be determined from EDGAR: Profitibility Liquidity Efficiency Innovation Growth Leadereship Surprises In this document we demonstrate the approach on how to calculate the Growth Parameters